
The Grafana documentary: The first 10 years
Get involved. Win a t-shirt.
Share the Story of Grafana on social media for your chance to win a limited edition Grafana 10 T-shirt! Participate with any of these options, or try them all to increase your chances of winning.
- On X or LinkedIn, post a link to any of the episodes, tag @grafana or @Grafana Labs, and include #StoryofGrafana in your post!
- Smash the like button and leave a comment to let us know what you love most about Grafana on the YouTube videos.
- On X or LinkedIn, like and leave a comment on Grafana’s #StoryofGrafana video posts with your favorite feature or how Grafana has impacted your life and work.
Ten winners will be announced on LinkedIn and X, and contacted directly via the respective social media channel on Feb. 9, 2024.
Community. Innovation. Fun.
Check out how Grafana has grown from a personal project into a thriving open source community and ubiquitous visualization tool.

Visualizing an earthquake detection system
With Grafana Loki, Prometheus, and Grafana, our observability is much more controlled … Everything is centralized and easy to access.
Choosing Grafana was a no-brainer for us because we saw that the tool has a future in front of it and a community behind it. It’s constantly being developed.

Early review of Grafana Cloud and Asserts

Monitoring love

Love for ObservabilityCON 2023

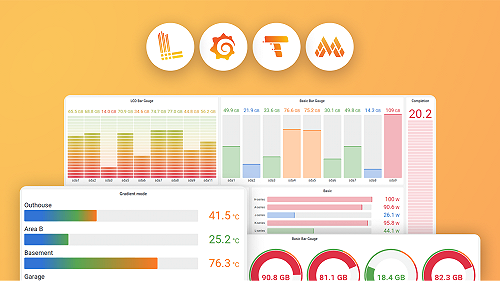
Loving Grafana 10.2

Scaling down experiment costs on AWS

Love for Grafana documentation

Shout-out to Grafana Customer Support

Top 10 Grafana dashboard moments

Formula 1 race

Call of Duty Modern Warfare 2

Game changer

Grafana Scenes

Better log context for log analysis

So much love for Grafana contributors

A top 10 tool for Kubernetes engineers

Monitoring pool levels with Grafana

A UI to easily configure SAML authentication

Top 10 Grafana features you need to know about

Love for the Canvas panel in Grafana 10

Grafana 10 feature demos

Private Data Source Connect

Torkel’s top 10 Grafana moments

Golden Grot winner: Real-time overview of the European energy status.

Golden Grot winner: Monitor Oracle’s JD Edwards EnterpriseOne software

Can’t not watch GrafanaCON 2023

A beautiful dashboard made with Grafana and InfluxDB

GrafanaCON 2023 announcements

Grafana 10.0 release

Canvas panel for customizing visualizations

A 12 out of 10!

Breaking a rocketing world record with Grafana
Love from Grafanafest
Metrics summary for Grafana Tempo

AI-generated titles, descriptions, and summaries

Integrate Grafana alerts with Grafana OnCall

Public dashboards

The Ocean Race

Grafana hits 1M instances

GrafanaCON 2023: Opening keynote

Just ask Grot: the Grafana Labs chatbot

How to build dashboards with visualizations and widgets

How to create an alert rule in Grafana 10.1

Aprende Grafana en 10 Minutos!

Creating Grafana Dashboards for Prometheus | Grafana Setup & Simple Dashboard (Chart, Gauge, Table)

Canvas panel for Grafana | Advanced animated SVG element

Grafana Labs’ top 10 moments of 2022
With Grafana and Grafana Loki, we can now deliver insights to engineering leadership that we weren’t able to deliver previously.
There are almost no barriers to entry with Grafana. In fact, from the moment we downloaded it, we were up and running within 10 minutes

Monitoring Pretzel the pet python with Grafana

Prometheus query builder

Loki query builder

Command palette

Grafana 9.0 release

GrafanaCON 2022 announcements
Tracking a sourdough started with Grafana

Monitor a Tesla with Grafana
When looking for a solution we a need for visualization, customization, and the ability to handle heterogeneous data sources. That, to me, means Grafana.
Using Grafana’s dashboards to visualize our usage metrics, I’m able to make real-time decisions with confidence.

From strength to strength

Can Grafana run Doom?

Visualization suggestions

Explore to dashboard

Inifinity data source plugin

Grafanafest 2022

Getting started with Kubernetes Monitoring in Grafana Cloud

Dashboards for DAYS! - How we use Grafana in our #homelab!

Grafana Loki querying basics, log based metrics and setting alerts on logs

How To Build a Time-Series Graph in Grafana

Create your Business Grafana dashboard | Step by step for analysts | Grafana Tutorial

Best SIEM Dashboards - Grafana Install and Dashboard Creation

Beautiful Dashboards with Grafana and Prometheus - Monitoring Kubernetes Tutorial

NASA Astra launch

Grafana Labs in Times Square

GrafanaFest 2022

Home automation Grafana dashboard
From time to time, usually right after an outage, I am asked by the management in our organization about the monitoring we have in place: opening Grafana usually leaves the audience speechless.
Grafana is an amazing tool for gaining insights into data sets of any size, changing not just how we run our operations, but also how we think about our products and our mission.

Visualize Docker in 15 seconds

Grafana 8.0 release

Devs love Grafana

Monitor an avocado plant with Grafana

Chained variables

Grafana Tutorial For Beginners | Continuous Monitoring With Grafana | DevOps Training | Edureka

Meet Grafana LOKI, a Log Aggregation System for EVERYTHING
Grafana Live real-time streaming

Monitoring the Tour de France

Get started with Loki in under 4 minutes

Grafana Explained in Under 5 Minutes

Grafana Dashboard with JSON APIs. visualize JSON, CSV, Graphql, XML in grafana

Home dashboard for your kitchen

Behind the scenes at Wimbledon

Minecraft headquarters

How to explain Grafana to a 5-year-old

Raj Dutt and Torkel Ödegaard at GrafanaCON 2019

Grafana acquires Kausal

Microsoft’s underwater data center

GrafanaCON 2018

Öredev conference in 2017

Grafana Labs cofounders

Space X control center

The Grafana team at work in 2016

Grafana hits 12,000 instances in first year

All Things Open, 2015

The Grafana Labs co-founders in 2015

First GrafanaCON in 2015

Torkel introduces his new GitHub project

Torkel on his early work on Grafana

