Application observability with Grafana Cloud
Grafana Cloud Application Observability delivers out-of-the-box application monitoring by unifying OpenTelemetry and Prometheus data and accelerating root-cause analysis with proactive, knowledge-graph-powered insights.
Easy setup, immediate insights
Configure Application Observability in minutes to start ingesting data and detecting anomalies
Troubleshoot application issues faster
Automatically correlate metrics, logs, and traces across frontend, application, and infrastructure layers to surface critical issues and reduce MTTR
Avoid vendor lock-in
Combine OpenTelemetry and Prometheus instrumentation in Grafana Cloud to unify your telemetry and use PromQL-based query languages to query across your data
Trusted by everyone from startups to the Fortune 500
End-to-end application observability out of the box
See every service in real time with a service inventory showing health and performance
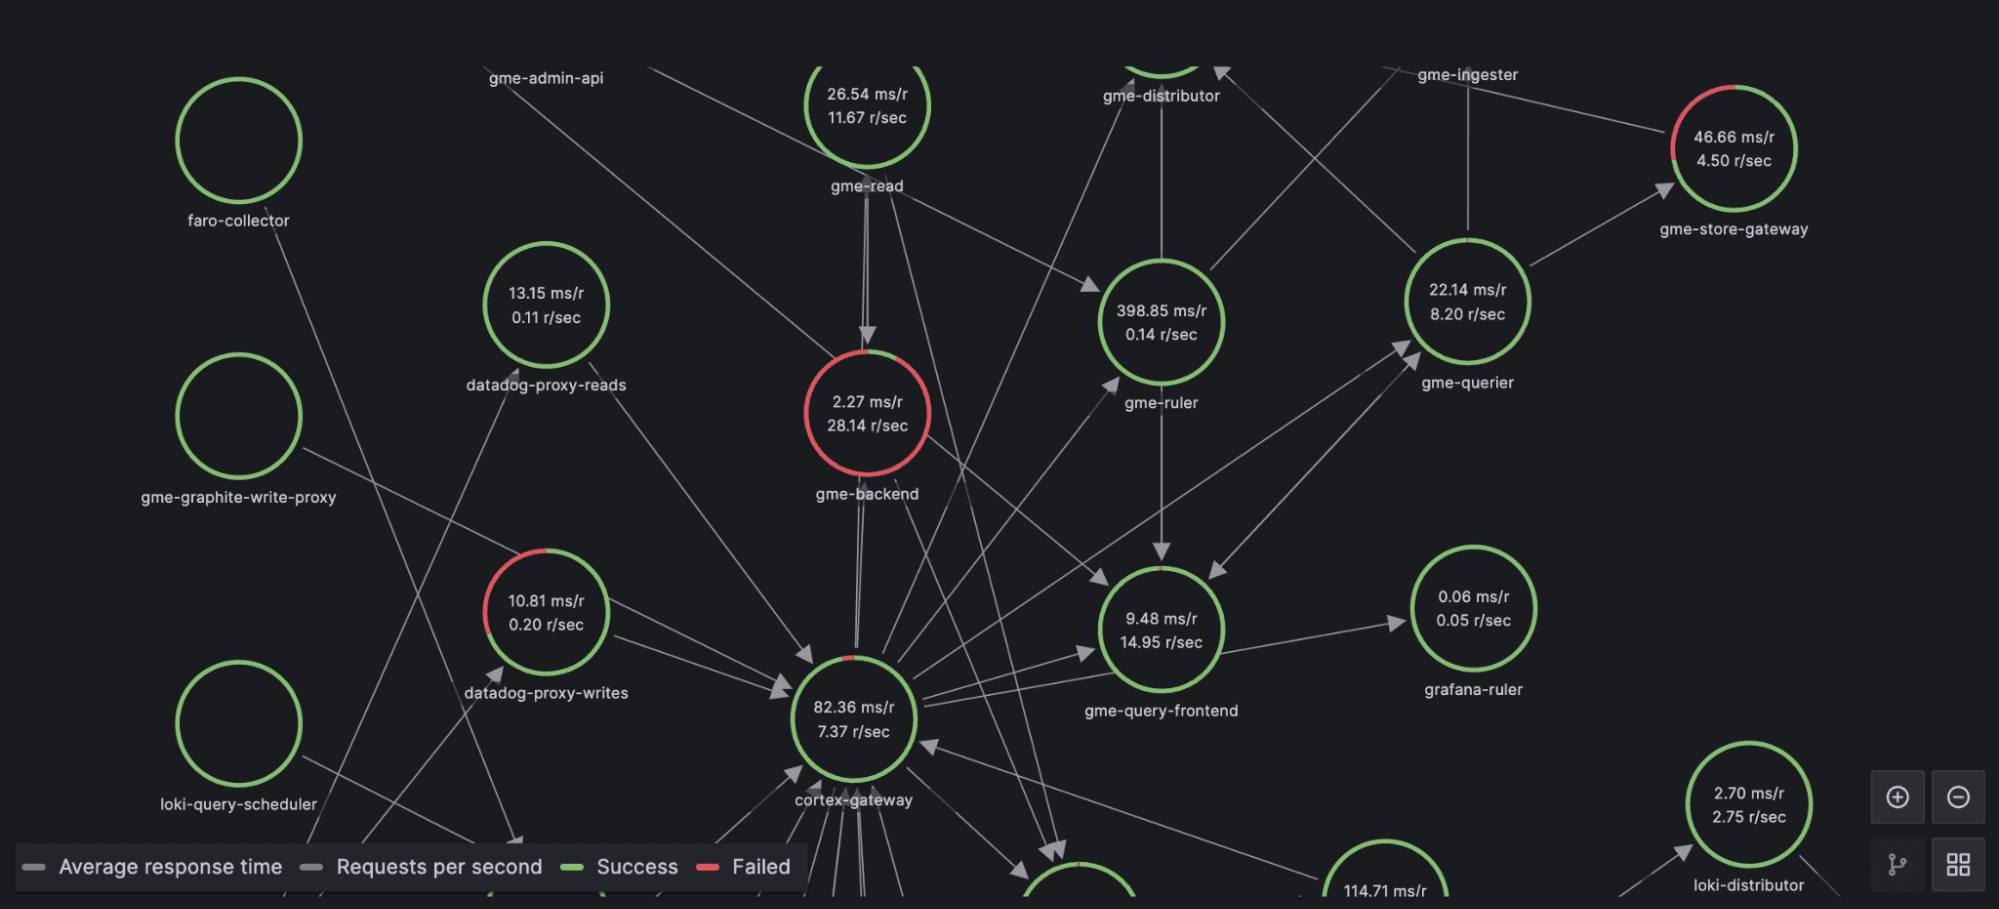
Understand how services interact using a dynamic service map that visualizes dependencies and activity paths
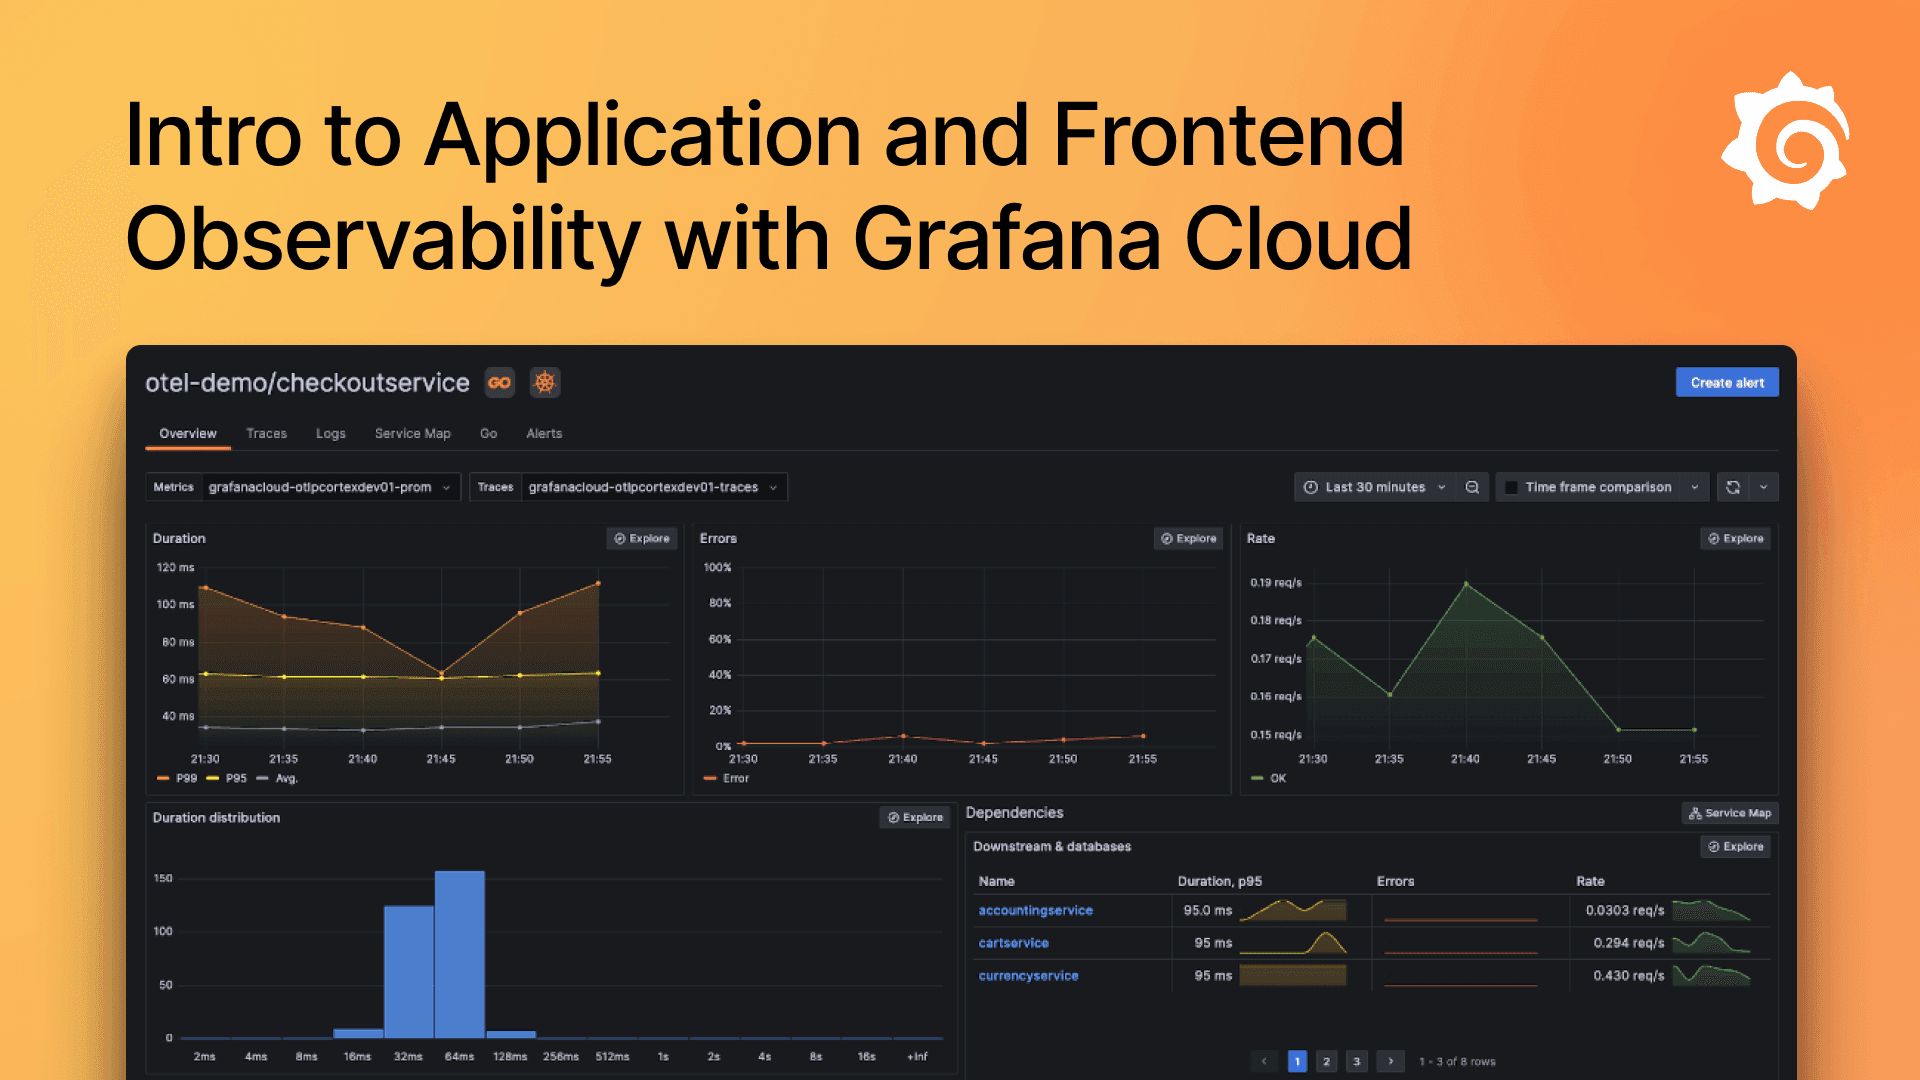
Isolate problematic domains faster with service overview, which shows RED metrics for a service alongside its dependencies and execution environment
Detect anomalies early through automatic baselining of performance metrics and knowledge graph insights
Correlate signals across the full stack
Unify telemetry by accessing metrics, logs, traces, and profiles with the OpenTelemetry data model
Connect infrastructure and application data seamlessly by correlating Prometheus metrics with OpenTelemetry application data
Easily navigate from the request duration panel to problematic traces and logs with a single click
Scale without overhead by storing data in fully managed, cost-effective Grafana Cloud databases
Find root causes faster with the knowledge graph
Surface critical insights, like saturation and errors, across your entire application stack
Find root cause faster with correlated metrics, logs, traces, and profiles in a single, shared context
Reduce MTTR dramatically with a unified view of anomalies, dependencies, and timelines
Compatible with OpenTelemetry and Prometheus
Built for OpenTelemetry and Prometheus from day one and 100% compatible with both open source projects
Instrument once, avoid lock-in by using OpenTelemetry auto-instrumentation agents or SDKs instead of proprietary tooling
Monitor infrastructure and apps together with Alloy, which has native pipelines for both Prometheus and OpenTelemetry
Real stories from real customers
"Grafana Cloud’s Application Observability turns our traces into actionable metrics, automatically giving us request error and duration data for all our services—and we can click into any service to see detailed data right down to each API."
Zachary SistrunkSoftware Developer III, Systems Integration, C Spire
No credit card required
Limited to 2,232 host hours per month
Community support
Pay as you go above the Free tier
50 GB ingested per month then pay as you go
30 days retention
8×5 email support
Scalable unit price based on annual commit
Premium support
Observability Architect
Deployment flexibility (Public Cloud, Federal Cloud, or Bring Your Own Cloud)
Why choose Grafana Cloud
Open & unified platform
OpenTelemetry-native observability and no lock-in, with out-of-the-box solutions like Kubernetes Monitoring, Application Observability, Grafana SLO, and RUM delivered in one unified experience.
Cost efficiency
Optimize costs without sacrificing insight with Adaptive Telemetry, which filters out unused data so your budget goes toward what actually drives value. Pair with cost management tools that help you monitor, control, and tune spend.
AI & automation
Grafana Assistant powers agentic workflows, prebuilt dashboards, intelligent filters, and customized alerts—surfacing the data you need for faster, more efficient incident response.


Welcome to
The open observability cloud
Built on open source, open standards, and open ecosystems
