cAdvisor Docker Insights
This Grafana dashboard offers a basic overview of key performance metrics for Docker containers in your system.


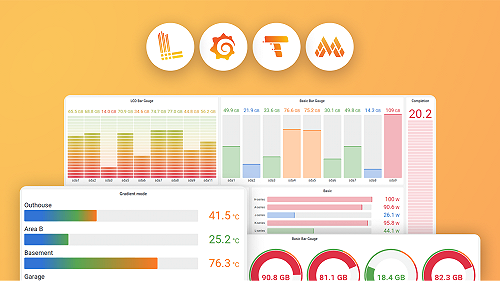
This Grafana dashboard offers a basic overview of key performance metrics for Docker containers in your system. By utilizing Prometheus for data collection and cAdvisor for container-specific insights, it provides a clear view of CPU, memory, I/O, and container restarts, allowing you to monitor and manage your containerized environment effectively.
Data source config
Collector type:
Collector plugins:
Collector config:
Dashboard revisions
Upload an updated version of an exported dashboard.json file from Grafana
| Revision | Decscription | Created | |
|---|---|---|---|
| Download |
Sign up for Grafana Cloud

Get up and running in minutes with the Grafana Cloud free tier, which includes free forever 10k metrics, 50GB logs, 50GB traces, 500 VUh, and more.
Get this dashboard
Data source:
Dependencies: