Apache Jmeter with influxDB Dashboard
Cloned Dashboard from official influxDB and noted the query type is flux, not fluxQl.


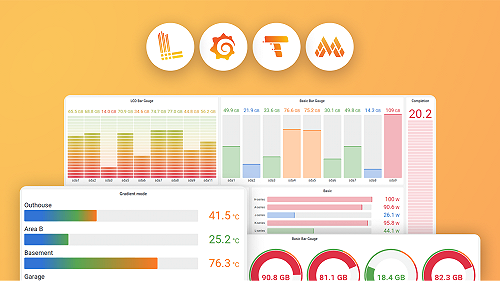
The Dashboard provides metrics about (User count, OK request count, KO request count, Number of hits, Avg response time, Max response time, Min response time, 99 and 95 percentile for successful request, Recived Bytes, Sent Bytes) its cloned from official influxDB to monitor Apache Jmeter metrics.
Data source config
Collector type:
Collector plugins:
Collector config:
Dashboard revisions
Upload an updated version of an exported dashboard.json file from Grafana
| Revision | Decscription | Created | |
|---|---|---|---|
| Download |
Sign up for Grafana Cloud

Get up and running in minutes with the Grafana Cloud free tier, which includes free forever 10k metrics, 50GB logs, 50GB traces, 500 VUh, and more.
Get this dashboard
Data source:
Dependencies: