Menu
Scroll for more
This is documentation for the next version of Grafana k6 documentation. For the latest stable release, go to the latest version.
Open source
Results output
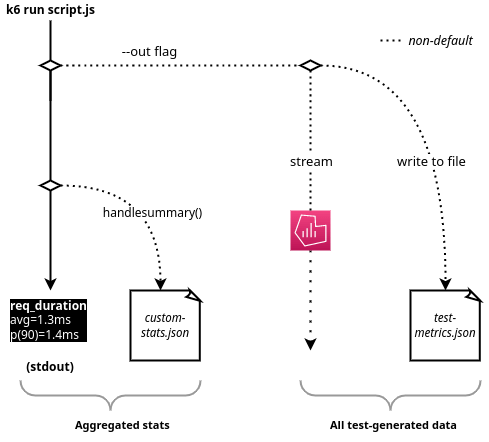
k6 emits metrics with timestamps at every point of the test. You can output the metric results as either aggregated statistics or individual data points.
- For a top-level test overview, use the end-of-test summary.
- For granular output of all metrics (with timestamps), you stream metrics in real time.
If you stream your metrics, you can either write them to a file, like JSON, or stream them to a service, like InfluxDB.

Read more
Was this page helpful?
Related resources from Grafana Labs
Additional helpful documentation, links, and articles:
Video

Performance testing and observability in Grafana Cloud
Optimize user experiences with Grafana Cloud. Learn real-time insights, performance testing with k6, and continuous validation with Synthetic Monitoring.
Events

User-centered observability: load testing, real user monitoring, and synthetics
Learn how to use load testing, synthetic monitoring, and real user monitoring (RUM) to understand end users' experience of your apps. Watch on demand.