Menu
Important: This documentation is about an older version. It's relevant only to the release noted, many of the features and functions have been updated or replaced. Please view the current version.
Documentation Grafana documentation
Visualize data
Drilldown
Profiles Drilldown
Access or install
Profile settings
Grafana documentation
Visualize data
Drilldown
Profiles Drilldown
Access or install
Profile settings
Enterprise
Open source
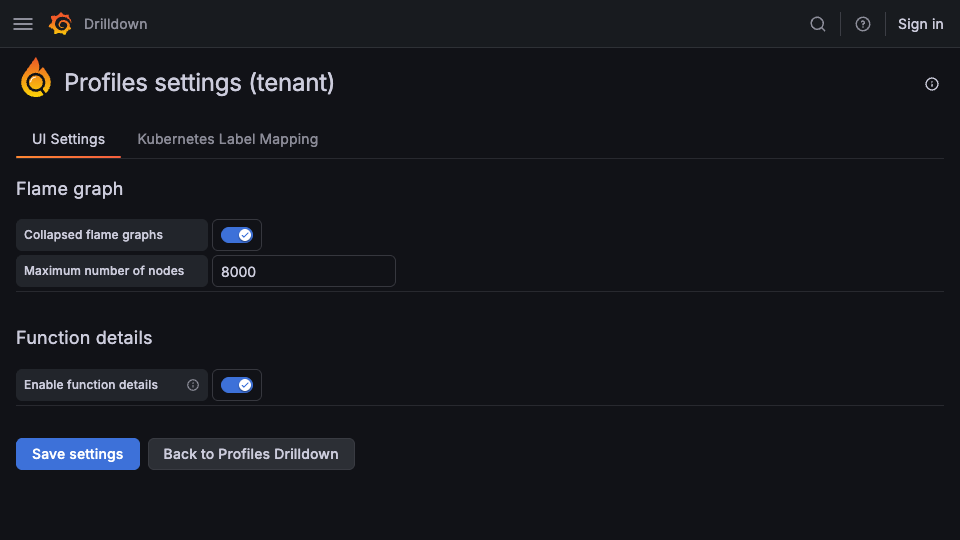
Profiles settings
The Profiles settings page lets you modify flame graph and function-details options used by Profiles Drilldown.
Modify settings
To change the settings for Profiles Drilldown:
- Sign in to your Grafana instance.
- Select Drilldown > Profiles in the left navigation.
- Select View/edit tenant settings in the top toolbar.
![Access tenant settings from the Profiles toolbar]()
- Change any options as desired.
- Select Save settings to preserve the changes.


