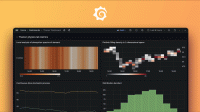
Application Observability automatic baseline
Note
Automatic baseline is currently in private preview. Grafana Labs offers support on a best-effort basis, and breaking changes might occur prior to the feature being made generally available.
Automatic baseline enables you to compare RED metrics for services and operations against historic upper and lower thresholds.
Automatic baseline is an opt-in feature. When you enable automatic baseline, Application Observability creates recording rules that create more metrics series and incur additional costs based on Grafana‘s regular pricing.
Automatic baseline is selectable from the Comparison selection and drop-down on supported pages.
Note
After you enable automatic baseline, it takes 24 hours to be available in Application Observability dashboards.
Detect anomalies
Automatic baseline show an anomaly band with lower and upper thresholds, errors only have an upper threshold, that capture the historic standard deviation of the metric.

If a metric is above or below a threshold it’s an anomaly, highlighted in the graph.

Automatic baseline is available under the following circumstance:
- For a service or an operation
- With one environment selected
- With no filters or group by queries
Enable or disable automatic baseline
You can enable or disable automatic baseline from the **Settings tab on the Configuration page under the Automatic baseline section.
When you enable automatic baseline, Application Observability creates recording rules under the appo11y namespace on the metrics data source and generates additional active series.
When you disable automatic baseline, Application Observability deletes the recording rules and metric series.
Initially it takes 24 hours for enough data to accumulate for anomaly threshold generation.
Was this page helpful?
Related documentation
Related resources from Grafana Labs


